Support Resistance zones are one of the most important aspects in Technical Analysis. They represent key price areas where supply and demand forces of the market meet.
The beauty of these Support Resistance market structures is that they are seen across all trading markets (Cash, Future, Commodity, Currency etc..).
And traders can use these zones for trading in any timeframes and trading styles.
Resistance is the price zone where selling is thought to be strong enough to prevent the price from rising further.
As the price advances towards resistance, sellers get more inclined to sell and buyers get less inclined to buy.
Support is the price zone at which demand is thought to be strong enough to prevent the price from declining further.
As the price declines towards support, buyers get more inclined to buy and sellers get less inclined to sell.
How to draw Support & Resistance zones?
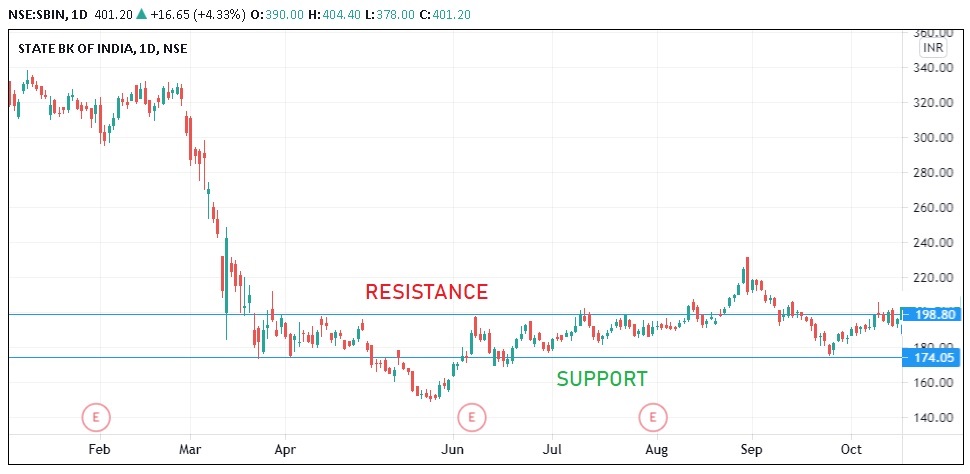
To draw a resistance, identify & connect two or more price points at similar level (zone) where prices face selling pressures.
Similarly, to draw a support zone, identify & connect two or more price points at similar level (zone) where prices face buying pressures.
The more number price points the horizontal line connects, the stronger is the S&R.
In the above example for State Bank of India, there is a good resistance zone around 198 – 199 price and good support zone around 174 – 175.
How to identify S&R strength?
The more times a given resistance level is tested and the longer it is tested, the stronger is the resistance.
If prices bounced off a resistance zone more often, there is a “Major Resistance” around that zone.
Minor Resistance is the zone where price face lesser resistance and not likely to hold buying pressure.
Similarly for Support, The more times a given support level is tested and the longer it is tested, the stronger is the support.
If prices bounced off a support zone more often, there is a “Major Support” around that zone.
Minor support is the zone where price face lesser support and not likely to hold selling pressure.
Traders see the strength of these S&R zones to effectively make trading entries, setting stop losses and existing trades effectively.
Support as Resistance & Vice Versa
Another principle of technical analysis stipulates that Support can turn into Resistance and vice versa.
This is a very important characteristics of support resistance zones.
Once the price breaks below a support level, the broken support level turns into resistance. And vice versa when price breaks resistance.

Dynamic Support and Resistance
The Support & Resistance levels we have spoken till now are static and horizontal in nature.
But there is another type of S&R Levels which are not static. They are moving and are not horizontal.
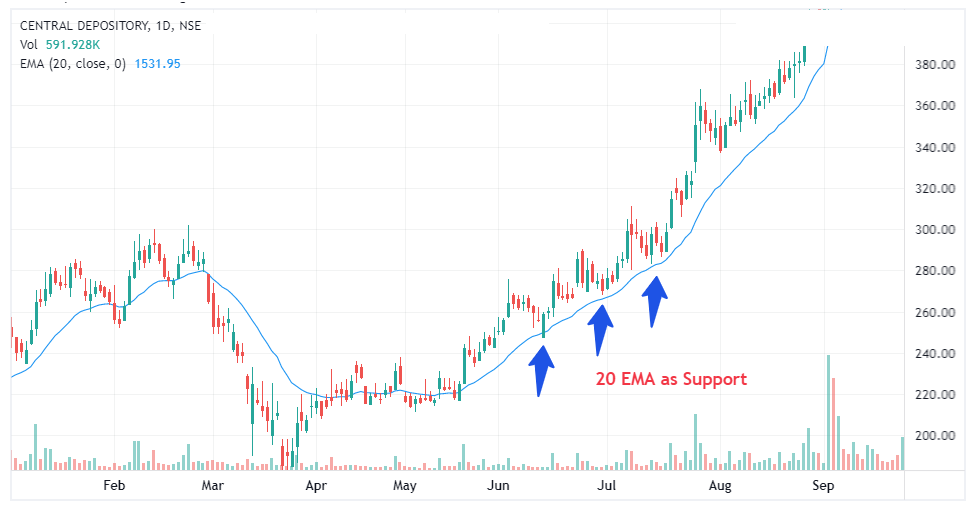
This type of S&R is known as Dynamic Support & Resistance. One best example of Dynamic S&R is Moving Average.
In the below example for CDSL, there is a strong uptrend with close moving support at 20 EMA levels. Here, 20 EMA is the dynamic support for the strong price movement after breakout in mid of May’20.
Traders can ride on this trend using the 20 EMA Support level. Notice how price stopped at 20 EMA several times when price pulls back in the strong uptrend.
These moving average support can be effectively used to protect your gains by using trailing stop loss just below the 20 EMA line.
What is breakout & its relation to S&R?
Traders also use these zones to enter and ride momentum stocks, after price breakouts.
Breakout is usually a term referred to break of Major Resistance or Support with higher volumes of buying or selling than its daily volume.
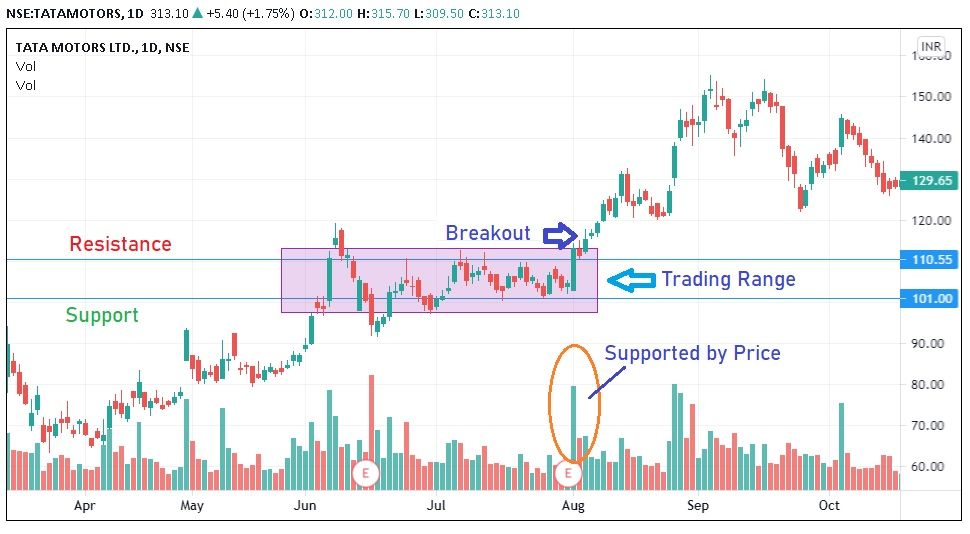
Breakout happens If a major resistance level is broken and buyers overcome the sellers .
The volume of buyers will outweigh the selling volume and there is high chance of price rising up further.
And vice versa for breakout at Support when the sellers will overcome buyers with high volumes and drag the price lower than the support level.
How Traders use Support & Resistance in trading?
1. Traders uses S&R to plan their entry price with minimal risks.
The best entry with minimal risk requires traders to know where are all the key Supply and Demand zones. And this is possible using S&R levels plotted on the chart.
Basis these levels, a trader can calculate the probable risk vs reward of the trade and plan their entry trade decisions accordingly.
2. Traders can use S&R to identify targets for their trade.
S&R are key levels where there are maximum selling pressure (in case of Resistance) or maximum buying pressure (in case of Support).
Hence, it is prudent for Traders to exit their trade before they reach these maximum selling or buying levels.
For Buy trade, Major or Minor resistance zones are the key target price to exit your trade. Similarly, for Short Sell trade, Major or Minor support zones are the key levels to exit or cover up your trade.
Range Trading Strategy involves entering trade at a minimum risk entry near Support or Resistance levels and exiting the trade before the strong Support or Resistance levels.
3. Traders manage their stop losses effectively using these S&R zones
Traders could also use S&R to protect their trade gains from a stock in a uptrend. Here, trailing stop loss could be placed using a dynamic S&R like Moving Average.
We have seen an example of this Dynamic Support & Resistance in the above example for CDSL chart.
4. In Breakout Trading Strategy
Break of Support and Resistance with good volume is what Breakout traders look for to trade. Traders keenly look for price congestion or strong volume activity near these levels.
Once a breakout happens from these levels, it gains quick momentum and trend to push the price higher or lower.
Conclusion
- Support Resistance is hence an indispensable tool for Pro traders for any markets, for any style of trading or for any timeframes.
- It can be used to effectively enter a trade, managing stop losses, trading breakouts and exiting trade successfully.
- A Support can become Resistance zone. And vice versa.
- Breakout is usually a term referred to break of Major Resistance or Support with higher volumes of buying or selling than its daily volume.





Thankyou for all your efforts that you have put in this. very interesting info .