Chart Pattern are patterns created due to movement of a Stock’s price on a chart.
It represents the Market’s Supply and Demand depicted on a chart as a shape or pattern.
These patterns are not found just in stocks’ chart.
In fact, these chart patterns could be seen in charts of Currency/Forex, Futures & Options, Commodity, Crypto Currency etc.
Moreover, Traders with different trading styles uses these patterns for their trading decisions.
Furthermore, it can be used in any trading market across the all. The basic functionality of the pattern does not change at all.
And patterns that formed over higher or longer timeframe (Daily, Weekly, Monthly, Yearly) are more reliable than that formed in lower timeframe (For e.g. Intraday)
Eventually, when price finally gets out of these patterns, it usually burst out in larger moves called Breakouts.
Breakouts introduces a significant shift in market sentiment over a small span of time.
Why does Chart Pattern get formed?
Isn’t it intriguing that these patterns are visible in charts of any trading markets?
And they get formed repeatedly on any timeframe charts?
How does this happen?
Let’s understand this.
Trading involves all major human emotions like fear, greed, euphoria, thrill, excitement, anxiety, panic, hope etc.
The plethora of emotions drives the supply and demand in the market. Market goes into a cycle basis these human emotions in trading.
The below diagram best explains the trading psychology behind the formation of market cycle.

Similarly, Price patterns form on chart when traders are buying and selling at certain levels through human emotional trading actions.
These emotional actions hence results in price actions footprints on the chart.
As a result, various price patterns hence gets formed on the chart in various stages of a market cycle.
Why Chart Patterns are useful for Traders?
Chart Patterns are an important tool for a trader using technical analysis and help predetermine price movements.
A Trader’s ability to recognize these patterns quickly and correctly is an art in trading.
A Pro trader could quickly identify these patterns on chart.
This gives them an edge over other traders who do not use this key tool for their trading decisions.
Depending on the patterns formation, Pro traders devise their trading strategies to buy or short the stocks.
These patterns, when combined with Candlestick formation & key Market structures like Support & Resistance, Moving Averages, Trend line etc., generally help determine the best entry price & time to buy or sell a stock.
It enables a Pro trader to devise an excellent strategy for trading in any market.
Types of Chart Patterns
- Reversal Patterns indicate reversal of a trend when price breakouts of the pattern.
- Continuation Patterns are patterns which indicate continuity of an existing trend.
- Bilateral Patterns are patterns that could either indicate reversal of trend or continuity of the existing trend.
Reversal Chart Patterns
Reversal Patterns are chart patterns that indicate reversal of a trend after its formation.
Here’s few top reversal chart patterns adored by Pro Traders for quite a long time.
- Double top Pattern
- Double Bottom Pattern
- Head & Shoulder Pattern
- Inverse Head & Shoulder Pattern
- Triple Top Pattern
- Triple Bottom Pattern
Understand them in detail here
Continuation Chart Patterns
Continuation Patterns are chart patterns that indicate continuity of a trend after its formation.
Here’s few top continuation chart patterns again used quite popularly by Pro Traders
- Bullish Flag Pattern
- Bearish Flag Pattern
- Bullish Pennants Pattern
- Bearish Pennant Pattern
- Ascending Triangle
- Descending Triangle
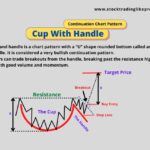
- Cup and Handle Pattern.
Understand them in detail here