Before we start with Stochastics, let us understand what are Leading and Lagging Indicators.
Moving Average & MACD are trend following Indicators which are effective only in trending market.
Lagging indicators follow price movement and hence they have lesser price predictive abilities – which mean they are not able to predict price movement ahead of time.
Unlike Lagging Indicators, Leading Indicators lead the price movement and they are effective majorly in ranging market (side-ways market). And they have price predictive abilities.
Two most popular Leading Indicators are Stochastics and RSI.

What is Stochastics Indicator?
Dr. George Lane developed Stochastics Indicator, a leading indicator to track market momentum. The indicator compares a stock’s closing price to its price range over a given time period.
The indicator consists of two lines oscillating between 0% and 100% and crossing over each other.
- A Fast line (%K) that compares the latest closing price to the recent trading range.
- A Slow line %D is a signal line calculated by smoothing %K. % D will always lag behind %K
The default setting for the Stochastics is 14 periods (days, weeks, months or an intraday timeframe) with %D drawn as 3-day simple moving average of %K.
Traders can tweak the default setting and see what settings best suits their trading styles. As for example, a day trader could be more comfortable with as 7 %K and 10 %D where as swing trader could use some other settings.
Oversold vs Oversold
When the Stochastic lines are above 80%, the price is in “Overbought” state and when it is below 20%, it is in “Oversold” state.
But it should not be taken as a strict rule. Even when the lines are above 80% for a long time, the price can keep increasing and keep falling even when the lines are below 20%.
If the Stochastic Oscillator is near 100, it signals accumulation. Stochastic near zero indicates distribution.
Stochastics Trading Signals
- Buy Signal when both the lines are in Oversold (below 20%) and fast line (%K) start crossing up the slow line (%D) from below and then rises over 20%.
- Sell Signal when both the lines are in Overbought (above 80%) and fast line (%K) start crossing down the slow line (%D) from above, dropping below 80%.
Let us consider an example to better understand the trading signals.

In the above example, when the Stochastic lines are in Overbought state (above 80%) and when the %K (blue line) cross down %D (red line) from above to cross down 80%, it gives signals to sell/sell the stock.
And when the stochastic are in Oversold State (below 20%) and %K (blue line) crosses %D (red line) from below to rise up above 20%, it gives signals to buy the stock at that price.
But please understand that signal given by an indicator does not mean that the signal would be correct at all times.
We should look for confluence of other signals like Moving Averages Cross Over, Trend Lines, Chart Patterns like Ascending / Descending Triangles, wedges etc..
Another good use of Stochastics would be to predict possible trend reversal “Divergence” in the Stochastic.
Divergence
Divergence happens when Price trend direction and the Stochastics direction are in opposite direction.
The “Divergence” concept is better explained with the below example.
In the below chart for L&T, the price is sloping downwards and the Stochastic is sloping upwards.
So, there is a clear divergence in the price and Stochastic line.
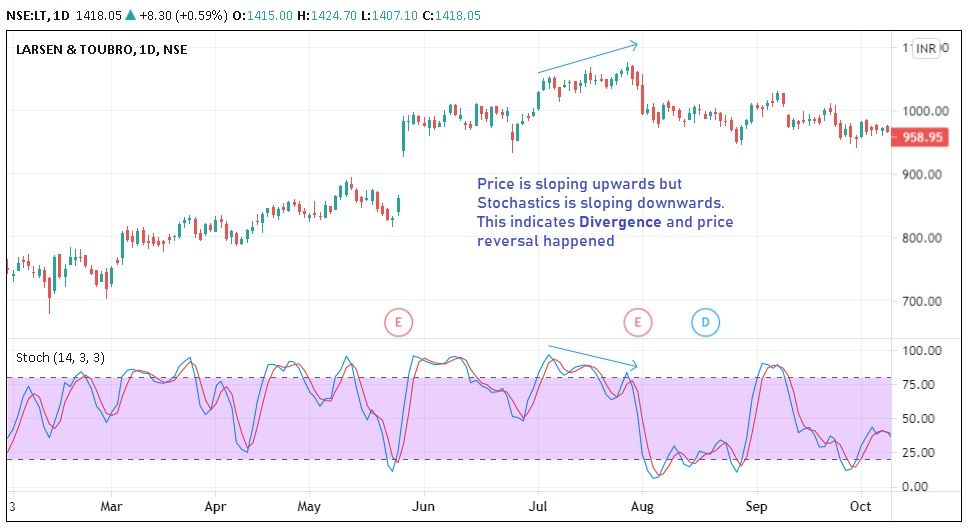
Whenever such divergence happens, there is a high possibility that a price reversal is on the cards.
A trader can look for “Stochastic Buy criteria” to enter the trade – when both the lines are in Oversold (below 20%) and fast line (%K) start crossing up the slow line (%D) from below and then rises over 20%.
Conclusion
1. Stochastics is a leading Oscillator
2. When both Stochastic lines are above 80%, the Stock is in “Overbought” state and when it is below 20%, it is in “Oversold” state.
3. Buy Signals – when fast line (%K) start crossing up the slow line (%D) from below and then rises over 20%. Both lines are in Oversold at the time.
4. Sell Signals – fast line (%K) start crossing down the slow line (%D) from above, dropping below 80%. Both lines are in Overbought at the time.
5. Apart from using Stochastic signals for trade entries, we should look for confluence of other signals from Moving Averages, Trendlines, Chart Patters etc..
6. Stochastics can be used to indicate trend reversals through Divergence in Price and Stochastic direction