Do you know why Average True Range (ATR) Indicator is amongst the favorite tool in a Pro Trader`s Toolkit?
Let`s find out why.
It`s very important for Traders need to know volatility in the market to make money.
Short term traders like Day traders or Scalp traders thrive on volatility. This is understandable as they need to get in quickly in a trade and exit as soon as their target is reached through the volatility swing of the Stock`s price.
ATR Indicator is just the right tool for traders to measure the volatility in a stock`s price. It guides them on how to best use volatility in their trading strategy for the right entries, exits and to manage stop losses.
Introduced by J. Welles Wilder Jr. in his book New Concepts in Technical Trading Systems, ATR was originally developed for commodities markets but gradually it got used in all markets.
Average true range (ATR) is a volatility indicator that measures volatility in a stock’s price.
ATR does not indicate the price direction not it is a momentum indicator. It usually is believed to be a momentum indicator but it isn’t.
Volatility is different from momentum in a stock. Momentum measures the strength of price movement in a given direction – upside or downside.
If you see many candles with long wicks for a stock, it is a volatile market.
On the other hand, if you see market with many candles with almost no wick in a particular direction (upside or downside), it is less volatile and has higher momentum.
One popular indicator for gauging momentum is the relative strength indicator.
Therefore, it is important to not confuse Volatility with Momentum of a stock.

ATR gives Traders an indication of how much the price could be expected to move. And this knowledge is so crucial for traders to use in their trading strategies.
How is ATR Calculated?
To calculate the ATR, first calculate a series of true ranges (TRs).
The TR for a given trading period is the highest of the 3 cases below:
- Current high minus the previous close
- Current low minus the previous close
- Current high minus the current low

To calculate the average true range, you take the average of each true range value over a fixed period of time.
ATR = (Previous ATR * (n – 1) + TR) / n
Where:
ATR = Average True Range
n = number of periods
TR = True Range
Absolute value is used for calculation and ignores positive / negative values
As a default, the number of periods used in the calculation is 14.
Traders can choose to use their own periods, rather than 14 days. Shorter period will generate more signals and longer periods will give lesser signals for trading.
How do you read the ATR?
A stock which has high level of volatility will have higher ATR value than a lower volatility stock.
A High ATR value gives an indication of strong volatility in the market.
We can see high ATR when there is a possible reversal in trend direction from Bullish to bearish or vice versa. That is the zone we generally see heavy tug and war between the Bull and Bears.
A strong trending market, whether it is uptrend or downtrend, may see lower ATR.
A prolonged side-ways market will also generally have very low ATR. This prolonged period of low ATR values usually indicates a consolidation time and the likelihood of further continuation move or reversal.
What ATR cannot tell you?
- ATR does not give you the direction of Stock’s price movement.
- It is not a trend following indicator. Hence, ATR will not tell if a trend is about or reverse or not.
- ATR does not measure Momentum of a stock.
Use of ATR Indicator
1. ATR Indicator for Entry decisioning
Short term Traders can plan their entries using ATR Indicator.
ATR is a useful for Day Traders to analyze when to enter a trade by checking volatility in the market.
Let’s take an example to understand this.
Suppose a stock moves 2$ a day as evident from its daily ATR. And on a particular day, it has moved 3.5$ which is much higher than the usual 2$.
Though traders might have a got entry signal for the trade, they would be reluctant to the take this trade as priced has moved much higher than what the ATR has predicted.
There is a good chance that the Stock will reverse if you initiate the trade that day.
Short terms trader can use ATR in conjunction with other indicators and strategies to plan trade entry and exit points.
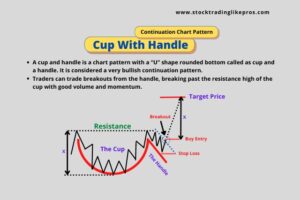
2. ATR Indicator for Breakout Trading
ATR Indicator is very useful to enter in time before huge price moves like Breakouts.
A quick on why Breakout actually happens.
Breakout happens when there is a consolidation of price over a period. Buyer and Sellers have much low interest during this period.
Hence ATR is very low during this period.
This is an indication for Traders that there could be possible big move to continue the trend or reverse the existing trend.
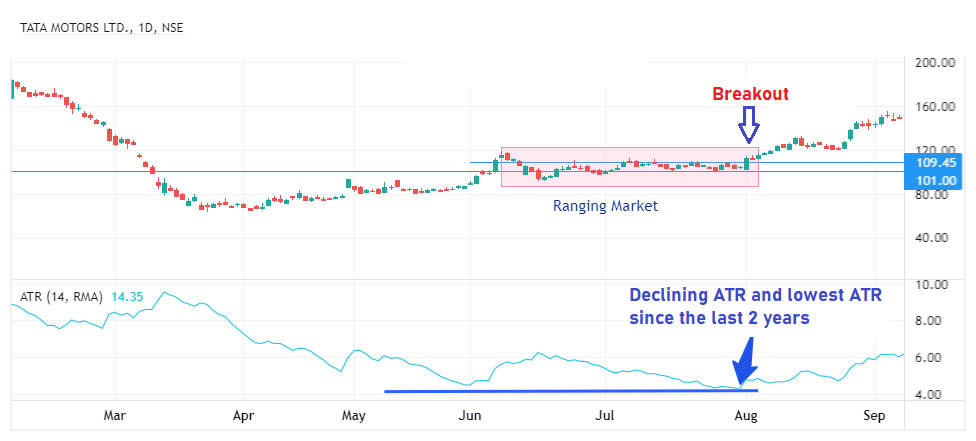
Let’s understand this below example where a triangle formation is seen in Tata Motors chart.
ATR has been declining and current ATR is at its lowest for almost 2 years.
This gives a good indication that Breakout from this consolidation zone is possible in the near term. Traders understand this and use this information in their Breakout Strategy
3. ATR for Stop Loss Placement
Has it happened ever that you are confused on where to place the stop loss?
If you put tighter stop loss, you get thrown out of the trade too early even when your market direction is correct.
And if you put a wider stop loss, you lose a good amount when the market goes against you.
I bet you guys have faced this. This is every trader’s dilemma.
ATR could be used as a very effective tool for Stop Loss placement to tackle your above dilemma.
As it takes into account price volatility, you kind of know how much price could swing or move within a specific time period ( 5 mins, 1 day, week or month etc…)
You then accordingly set you stop loss away from the price swing but as per your risk appetite.
Generally, Traders could use 2* ATR as a reasonable stop loss level.
When buying a stock, you could place a stop 2*ATR below the entry price. And when you plan to short sell, you could place a stop 2*ATR above the entry price.
But it is not a hard and fast thumb rule. All depends on how much risk you can take.
If you see a good support or resistance near your entry price which lets you put tighter stop loss, you could also use 1 ATR stop.
Here’s a good example for Coal India where we have use 1 ATR stop loss and it has given us 1:4 Risk Reward ratio.

4. ATR as trailing stop loss
You can use ATR indicator as trailing stop loss and ride on trends.
A trailing stop loss is an exit method to get out of a trade if price does not go into your favour. At the same time, this also enables you to protect your gain by trailing the exit point if the price is moving in your favor.
There are many indicators which use ATR for trailing stop loss. You could choose to use one of them.
Check the below example where we have trailed stop loss using ATR Trailing Stop Loss by ceyhun indicator

5. ATR for exiting your trade
Since ATR gives you a sense of how much market can swing around a mean, it could give an idea of how much the price could move the maximum.
And it price moves beyond this, we will sort of know that we sort of know that price has reached its maximum movement and is likely to reverse.
Basis this knowledge, you can easily set your price target.
One commonly used exit method using Chandelier exit, developed by Chuck LeBeau, uses ATR for this.