
What is a Cup and handle?
A Cup and Handle Stocks Pattern is one of the most powerful patterns a trader can see in a Stock’s chart.
The pattern was first introduced by American technician William J. in his 1988 classic, How to Make Money in Stocks.
A cup and handle Stocks Pattern is considered a bullish continuation pattern. Traders trade this pattern in the direction of the trend.
Cup and handle patterns generally give a high percentage win rates with a very good risk / reward ratio.

How to identify the pattern?
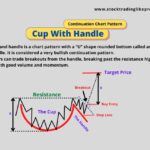
The pattern get its name from the “U” shape rounded bottom like a cup and a handle formation.
The cup has almost equal highs on both sides. A pullback from the right high of the cup forms the handle. The retracement is around 1/3 rd from the high of the cup.
The handle has to be smaller than the Cup. The handle could take the shape of a Flag or a triangle.
We could also see a V shaped pattern but this should generally be avoided. Overly deep cup should also be avoided.
A successful Cup and Handle pattern will see breakout from the handle, breaking past the resistance high of the cup with good volume and momentum.
This presents a very good opportunity for Buyers to make quick profits from the price & volume momentum in just few days.
The pattern formation period could take somewhere between 1 month to year.
Now, let’s understand how exactly William O’Neil identified this pattern
As per William O’Neil, the pattern will undergo 4 primary stages to form the complete Cup and Handle pattern.
- In First Stage, it should take around 1-3 months for the price to reach new high (left high of the cup)
- In Second stage, the price will pullback to no more than 50% of the previous high creating a rounding bottom.
- Third, the price will scale to its previous high again (right high of the cup). This right high will not sustain and decline, forming the “handle” part of the formation.
- Finally, the price breaks out from the handle with good momentum and breaking the resistance formed because of the left and right highs.
Timeframes where pattern is seen
The cup and handle pattern could be seen in almost all timeframes like a 5-minute chart or in higher timeframes like daily, weekly, and monthly charts.
But the pattern is generally more successful to trade in higher timeframes.
How to trade the Cup and handle Pattern?
1. Identify the Pattern
Identify the pattern in a stock’s chart by visually confirming the U Cup and handle formation. Follow the steps mentioned above to identify the pattern.
2. Confirm the trend
Check the price trend in which the Pattern is formed.
For the Cup and Handle Stocks pattern to work, it should exist in an uptrend price movement.
To confirm the trend, look into the higher timeframe from the timeframe you identified the pattern. The higher timeframe should also confirm the same uptrend price movement.
For example, if you trade using Daily chart, the weekly chart should be on clear uptrend.
3. Pattern Validation
Once you see the pattern being formed, first confirm the Cup and Handle formation by validating it through volume.
Volume normally decreases after the left high as prices decline till the base of the cup. The base of the cup will remain with low volume for some time.
Then, Volume increases when the price begins to move higher from the base of the cup and test the previous high.
4. Wait for Breakout from the Handle
If a cup and handle pattern is confirmed from the above steps, it should be followed by a bullish price move upward from the handle.
The handle signifies the period where price pullbacks from the right high of the cup and consolidated for few days.
Look for price to breakout with good volume from the handle. Buy when the price breaks above the top of the handle.
5. Stop Loss
Place a stop-loss below the low of the handle.
6. Target
The target price of this trade could be seen as the same distance as the depth of the cup.
For e.g. If the bottom price of the cup is at 100 Rs and Left & Right high is at 120 Rs, the depth of the cup is 120-100=20.
Suppose, your breakout point is 107 Rs, you could take target price at 127 Rs (107+20)
In many cases, it could happen that the left side of the cup is at a different height than the right.
In those cases, use the smaller height; calculate the depth of the cup and add it to the breakout price for target estimation.
Let’s understand this better with a real example.
We can see a Cup and handle formation in Asian Paints in July-Aug’21.

Asian Paints has been on a strong uptrend in July’21 with its price above 50 EMA.
We see it hits an all time high of Rs 3159 with a huge breakout on 20th July’21. [This is the day we see Cup’s Left high get formed]
The price could not sustain and declined and consolidated around 2950 range where it finds support. This is the congestion area where we see rounded bottom.
On 23rd July, price hits the earlier peak of 3159 Rs. This forms the right high of the Cup.
Thereafter, the price retraces by around 50% for 4 days. This forms the handle of the pattern.
On the 5th day, it broke the handle with a breakout which is followed by big volume price movement in the next 2 days.
Where to enter?
You could enter at break of the Handle at around 3075-3100 range.
Stop Loss
Stop loss could be around 2985-3020 price range depending on your risk appetite.
Target
Target price could be taken +6.40% price above the breakout price, around 3374 Rs [since depth of the cup is around -6.40% below the left / right peaks of the cup]
If you see Risk / Reward, it is more than 3:1 and hence a very good to trade.
Limitations of the Cup and Handle Stocks Pattern
It is not necessary that the target price taken basis the depth of the cup could be met always.
It becomes much less clear what will happen after the initial breakout from the cup and handle pattern.
The momentum might not sustain after the breakout and could reverse or go sideways.
So, you need to keep checking the volatility and momentum.
Like all technical indicators, the cup and handle should be used in conjunction with other Indicators / Candlestick signals etc.
This is required to confirm the trading signal from the pattern.
The 2nd thing is that it generally takes some time for the pattern to be fully formed. This could lead to late decisions to trade.
Third issue could be due to depth of the cup.
Sometimes you could see a shallower cup and give you a perfect trading signal. Other times, a deep cup can produce a false signal.
Also, it could be seen that the cup could also form without the handle.


Spot on with this write-up, I actually feel this amazing site needs a great deal more attention. I’ll probably be returning to see more, thanks for the info!