What is ADX indicator?
The ADX indicator is a trend-following indicator. It measures the strength of a trend, whether it is a strong or weak trend.
Developed in 1978 by J. Welles Wider Jr, it is one of the most reliable Indicators currently very much in use by Pro traders to this day.
Pro Traders use it to determine whether a market is trending or ranging using ADX Indicator.
The ADX comprise of 3 lines – Positive (+DI) and negative (-DI) directional indicator and ADX lines
+DI and -DI Lines
+DI and – DI lines indicates trend direction.
If +DI is the higher than -DI line, it indicates trend direction is up. And if -DI is above +DI, it indicates trend direction is down.
Crossovers of these -DI and +DI lines with ADX line gives trading signals.
ADX line
The ADX (black line) is a non-directional indicator.
This line indicates whether the market is trending or ranging. Most importantly, it indicates momentum in a stock.
It is basically the average difference between +DI and –DI and is plotted from 0 to 100, with no negative values.
When ADX > 25, it indicates the trending market
And when ADX < 40, it indicates a strong trend

ADX Indicator – How it is calculated?
These three lines are calculated using the formulas below for 14 day period (taken as default and can be changed by traders)
+DI = ((Smoothed MA + DM)/ATR) * 100
-DI = ((Smoothed MA – DM)/ATR) * 100
DX = ((+DI – -DI)/(+DI + -DI)) * 100
ADX = ((Prior ADX * 13) + Current DX) /14
Where:
+DM = Current High – Previous High
-DM = Previous Low – Current Low
ATR = Average True Range
The above calculation will plot the three lines of the ADX indicator.
What does ADX value signify?
| ADX Value | What it indicates? |
| 0-25 | No Trend, Trading Range |
| 25-50 | Strong Trend |
| 50-75 | Very Strong Trend |
| 75-100 | Extremely Strong Trend |
How to use the ADX Indicator like a Pro Trader?
Pro Traders primarily use ADX Indicator in 3 different ways
- Determine Market Direction
ADX is used to determine whether a market is trending or ranging.
- Validate Breakouts
ADX can be used to validate Breakouts by measuring the momentum of the price movement.

- Generate Trading Signals when used with other indicators
ADX could be used with other Indicators like Moving Averages, MACD, RSI etc. for high probability trading signals.
Let’s dive into these 3 strategies in detail.
1. Determine Market Direction
Basis the market direction envisaged by ADX, Traders can trade accordingly using appropriate strategy – Trend Trading Strategy or Sideways market trading strategy.
There are different Trend Trading Strategies which uses ADX as a key component of the strategy.
One popular strategy is Holy Grail Strategy where ADX > 30 is used a key criteria to signal very powerful trend for the strategy to be successful.
Here’s few other Trend Trading strategies using ADX to confirm market direction.
Catch the Trend – Swing Trading Strategies
2. Validate Breakouts
It is very important for Momentum traders to validate the breakouts before entering their position in a stock.
ADX is generally used as a key tool by these traders to validate breakouts. Through this indicator, traders get an idea of the momentum of the price movement.
Here’s the thumb rule traders follow –
When ADX stays above 25, the breakout is more likely to sustain.
And a breakout with an ADX reading of below 25 will be likely unsustainable.
3. Generate Trading Signals when used with other indicator & patterns
ADX gives powerful high probability trading signals when used in conjunction with other indicators, candlestick or other price action patterns.
Let’s understand these in detail with the below example for Pidilite Industries chart.

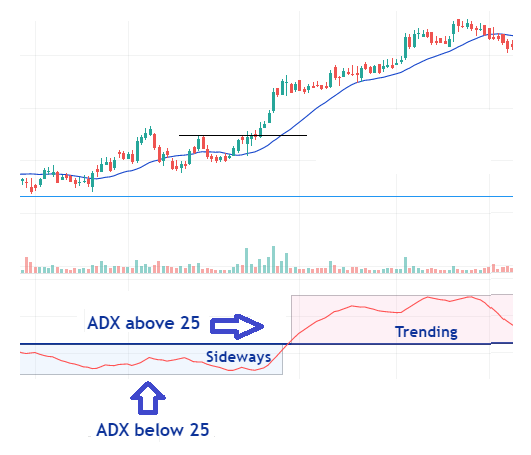
As you can see stock price movement for Pidilite started going into a strong sideways or ranging market.
ADX at this time is below 25, confirming the strong ranging market.
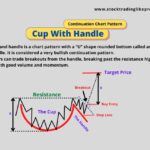
Price started getting momentum around middle of May’21. By the end of May, it is in a strong uptrend following a breakout from a small Cup and Handle formation.
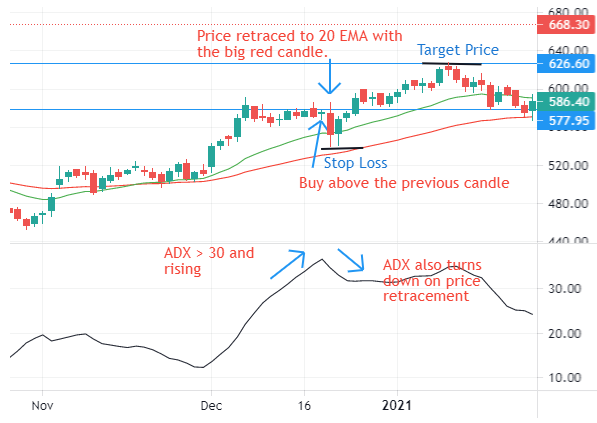
The trend is also confirmed as price remains above 20 EMA throughout this period till first week of Aug’21.
ADX during this period is above 25 and confirms the strong strength of the uptrend. And as ADX is above 25, the breakout also sustained and gain momentum further from the breakout point.