The advantage of candlestick chart patterns is their ability to highlight trend weakness and reversal signals that may not be apparent on a normal bar chart.
Most Importantly, multiple candlesticks send very important signals to traders through formation of reversal and continuation patterns.
It is important to note that all these candlestick patterns give an indication of potential trend reversal change, not a signal to buy or sell.
Traders should use these patterns in combination with other indicators and signals to make their trading decisions.
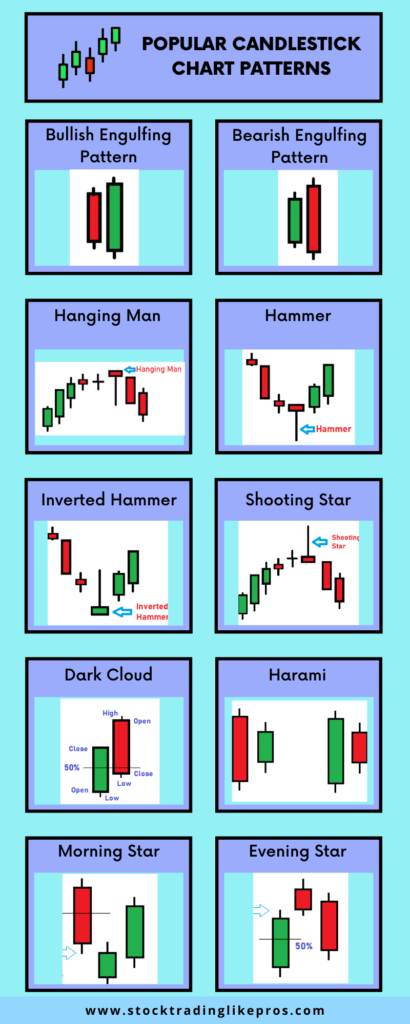
Popular Candlestick chart patterns
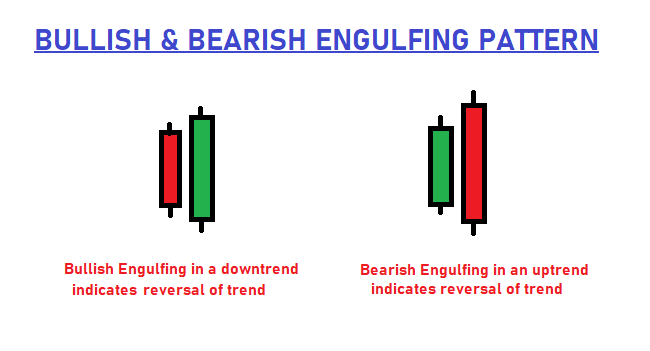
Bullish Engulfing Pattern
Bullish Engulfing pattern occurs at the bottom of downtrend where the bearish candle (Red Candle) is totally contained within the next day bullish candle (green candle).
Bearish Engulfing Pattern
This pattern occurs at the top of uptrend where the bullish candle (green candle) is totally contained within the next day bearish candle (Red Candle).
Hanging Man Candlestick Pattern
The Hanging Man candlestick chart formation is a bearish reversal pattern.
This pattern occurs mainly at the top of uptrends and is a warning of a potential reversal downward.
The candlestick type does not matter. It can be either green or red.

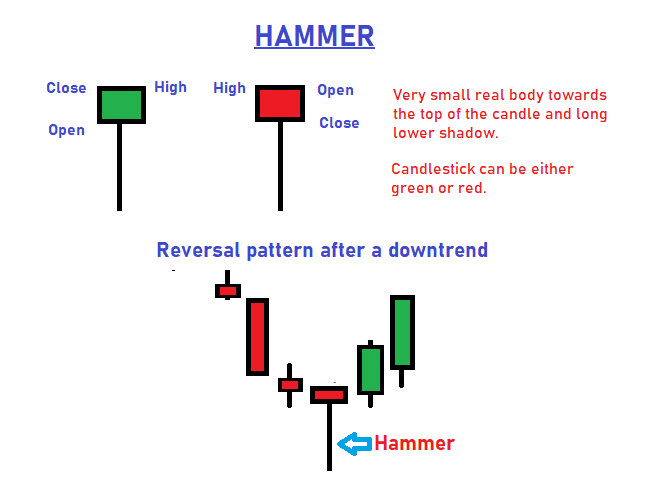
Hammer Candlestick Pattern
Hammer is a bullish reversal pattern.
This candlestick formation usually occurs in bottom of downtrend and indicates a likely reversal of trend.
The candlestick type does not matter. It can be either Green or Red.
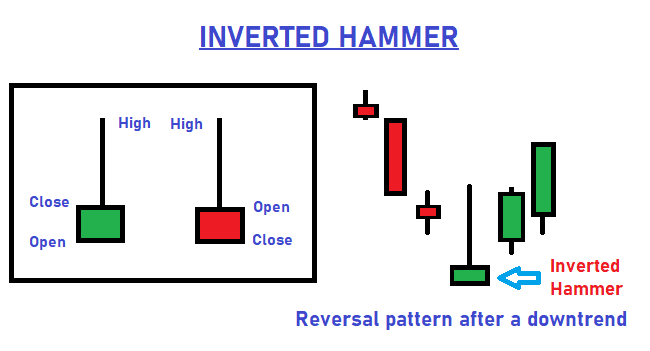
Inverted Hammer Candlestick Pattern
The Inverted Hammer candlestick formation occurs mainly at the bottom of downtrends and indicates a likely reversal upward.
Shooting Star Candlestick Pattern
The Shooting Star candlestick formation is a significant bearish reversal candlestick pattern that mainly occurs at the top of uptrends.

Dark Cloud Candlestick Pattern
A bearish reversal pattern that continues the uptrend with a long white body.
Criteria for formation: The next day opens at a new high, then closes below 50% of the body of the first day.

Harami Candlestick Pattern
Harami in Japanese means ‘pregnant’ which is quite descriptive.
Criteria for formation: The second candlestick must be contained within the body of the first.
This is a candlestick chart pattern formation indicating loss of momentum and often warns of reversal after a strong trend, uptrend or downtrend.
Harami Candlestick pattern is similar to “Inside Bar” in Price Action Trading. Inside Bar is a very popular pattern basis which an Intraday Trading Strategy – ID NR4 is based on.

Morning Star Candlestick Pattern
The Morning Star pattern signals a bullish reversal after a down-trend.
It is a 3 candle pattern formation with the below ideal criteria
- Firstly, the first candlestick should a long red body.
- Secondly, The 2nd candlestick gaps down from the first.
- Lastly, the 3rd candlestick should ideally have a long green body and should close in 50% of the body of the first candlestick.
The 2nd candle can be either Green or Red Candle. However, the pattern is more bullish if the second candlestick is Green.

Evening Star Candlestick Pattern
The Evening Star pattern is opposite to Morning Star and is a reversal signal at the end of an up-trend.
It is a 3 candle pattern formation with the below ideal criteria
- Firstly, the first candlestick should be long green body.
- Secondly, The 2nd candlestick gaps up from the first.
- Lastly, the 3rd candlestick should ideally have a long red body and should close in 50% of the body of the first candlestick.
The 2nd candle can be either Green or Red Candle. However, the pattern is more bearish if the second candlestick is Red.