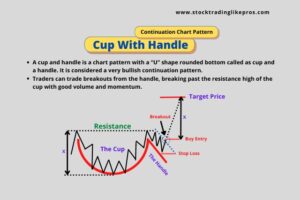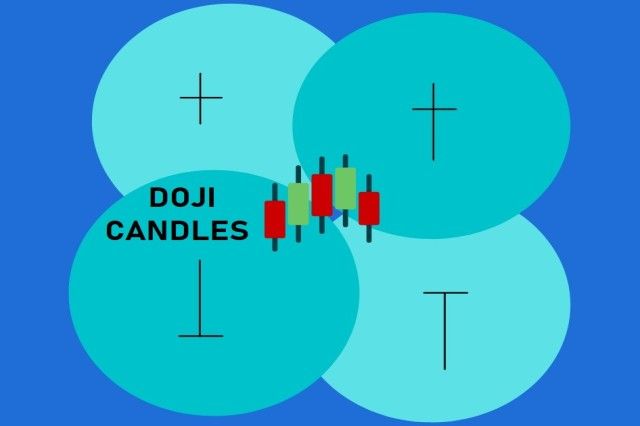
What are Doji Candles?
A Doji is a candlestick pattern with its Opening Price and Closing Price are the same, forming a cross like formation.
Sometimes the Opening and Closing price are almost equal but not the same. This could be considered a Near Doji Day Candle.

Doji Candles are powerful patterns that signifies balance between buying and selling pressures. This balance could trigger a change in trend direction anytime soon.
The trend change could be sideways. Or, it could be a V like reversal from existing uptrend to downtrend or vice versa.
Why Doji Candles get formed?
The doji candlestick represents indecisiveness of buyers and sellers in the market.
After a stock’s opening, Buyers push the price higher to the day’s high but it could not be sustained. Sellers push down the price and finally, the stock closes at where it opens.
Types of Doji

1. Standard Doji
This is the usual Doji variant where it has low to normal wicks.
Outlook: Bullish or Bearish depending on where it is found – in uptrend or downtrend.
2. Long legged Doji
Long Legged Doji or Rickshaw man is a crucial pattern found on Market top. It has long upper and lower wicks, indicating indecisiveness.
Outlook: Bullish or Bearish depending on where it is found – in uptrend or downtrend.
3. Gravestone Doji
This is the Doji formation where the Opening and Closing prices are same at the low of the day.
While this can also be seen in Market bottoms, it usually is more prevalent on Market tops.
The gravestone doji could be seen as variant of Shooting Star but more bearish than a shooting star. The shooting star has a small red / black body but gravestone does not have any real body.
Outlook: Bearish (because price could not maintain its day’s high, due to selling pressure and closes at the level of Opening price).
4. Dragon Fly Doji
Opposite of Gravestone Doji and could be seen more on market bottoms.
The Dragon Fly doji could be seen as variant of Hammer but more bullish than a hammer formation.
Outlook: Bullish (because price rises from its day’s low due to buying pressure and closes at the level of Opening price at the top)

Significance of Doji Candles
If the doji candlestick gets formed in an uptrend, it could indicate the uptrend is losing steam due to the indecisiveness.
The buying sentiment in the market has started losing momentum and traders could see this as a sign of trend reversal.
Similarly, if the doji candlestick gets formed in a downtrend, it could indicate downtrend is losing steam due to indecisiveness.
The selling sentiment in the market has started losing momentum and traders could see a sign of trend reversal.
Just because a Doji Candlestick gives signal for trend reversal does not mean that traders should their trade immediately. You should get confluence of other signals from Technical Indicators or your Exit strategy.
If Doji is seen in long rallies, they could give us strong signal for a market top and could change direction post the formation soon.
Doji needs more confirmation to indicate a market bottom than a market top. This could be due to the fact that market could fall more easily due to panic selling than the market rise.
How to trade using Doji Candles?
Doji Trading Strategies
- Trade Doji as a Reversal Signal
Doij Candles can give strong reversal signals when used in conjunction with other candles to form a more powerful pattern like a Double Doji, Evening Star Patterns.

- Trade Doji as Continuation Signal
Doji Candles seen after Bullish Candles and near to the closing price of the Bullish Candle gives a very strong continuation signal, especially after a breakout from a range.

- Trend Trading using Doji Candles
Doji Candles seen after a pullback of price towards Moving Average could be used to trade trending market.
Let’s understand these 3 strategies in detail.
1. Doji Candlestick as Reversal signal
Doji on its own could not give reliable signals for trend change. It should be used in conjunction with other Indicators to give confirmation for reversal
You could use in combination with other candles to form a more powerful pattern like a Double Doji, Evening Star or rare Tri-Star Pattern
Here’s an example of an Evening Star Pattern with a Doji which gives a strong reversal signal at the top of an uptrend
Another variant of the Evening Star could be a Tri-star Pattern which has Doji Candlestick on all 3 candles of an Evening star formation.
This is a very rare formation but when it gets formed, it gives a very strong signal for trend reversal.

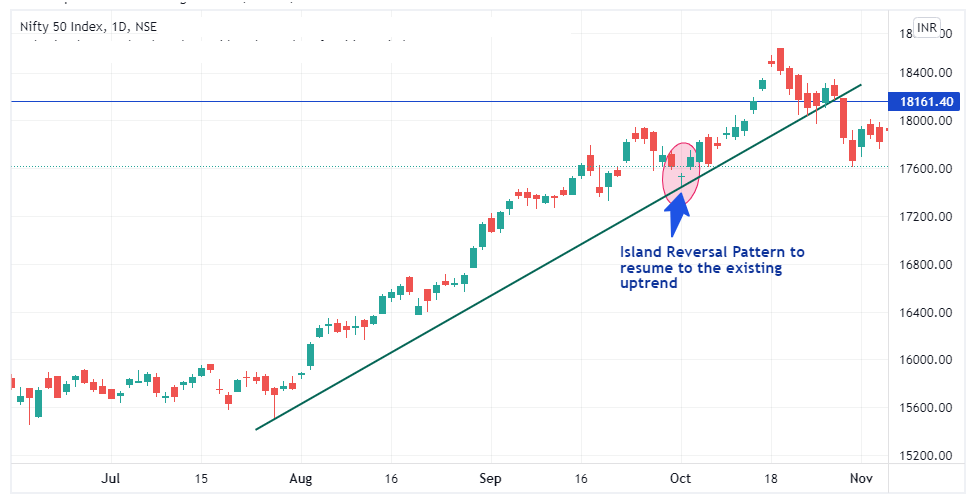
One more popular pattern of Doji Candlestick as Reversal pattern can be seen in Island Reversal formation.
It could be Bullish Reversal or Bearish Reversal depending on where is found – uptrend and downtrend and the shift in sentiment to reverse the trend.

Here’s an example of Island Reversal pattern on Nifty chart.
2. Doji Candlestick as Continuation signal
Doji does not only give reversal signal.
Dojis seen after Bullish Candles and near to the closing price of the Bullish Candle gives a very strong continuation signal, especially after a breakout from a range.
Same continuation signal could be seen in strong uptrend when Doji follows a Bullish Candle near its closing price.
Similarly, Dojis seen after Bearish Candles and near to the closing price of the Bearish Candle gives a very strong continuation signal when it is formed just after a breakdown or in midst of an existing downtrend.
If Doji is an Inside bar, it lends more strength to the continuation signal.
A quick on Inside Bar Doji formation
Inside Bar is a pattern when a candle, called Inside Bar, is engulfed completely within highs and lows of the preceding Candle, called Mother Bar.

Dojis could also be seen in 1-2-3 continuation pattern and when it does that, it gives good signal for a breakout.
In a 1-2-3 Continuation Pattern, a Bullish Wide Range Bar is followed by 1 or more Inside Bar in the upper range of the Bullish Wide Range Bar.
Here, in the below example of Adani Enterprises, we can see a strong up move after a breakout in first week of Feb’21.
The market pulls back to 20 EMA in last week of Jan’21 & then resumes the up move when 3 Dojis are seen near to the closing price of the preceding candles.
We could also Inside Bar Doji formation which further pushes the price up.

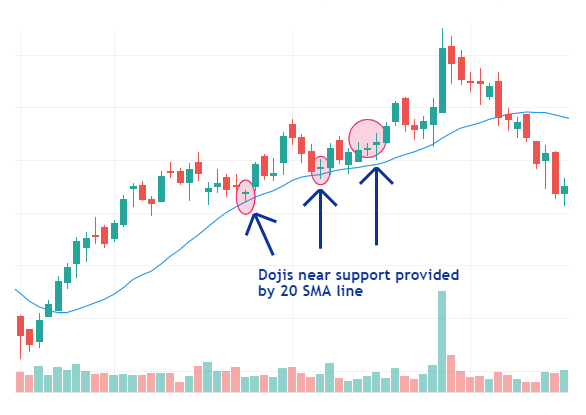
3. Trading Trend with Dojis
When Doji Candles are seen near major Demand zones, it increases the strength of the Support provided by Buyers.
Similarly, When Dojis are seen near major Supply zones, it increases the strength of the Resistance provided by Sellers.
When a Doji is seen after a pullback of price towards Moving Average, it could be used to enter the trending market.
Here, Moving Average is the Support or Resistance zone depending on whether the market is in uptrend or downtrend.