What are the top Continuation Chart Pattern for trading?
Continuation Pattern for trading stocks in an existing trend – uptrend or downtrend, is a powerful trading strategy used by Pro traders for a long time.
They signify continuity of the existing trend.
Let’s understand in detail few of those top continuation chart pattern for trading.
Flags
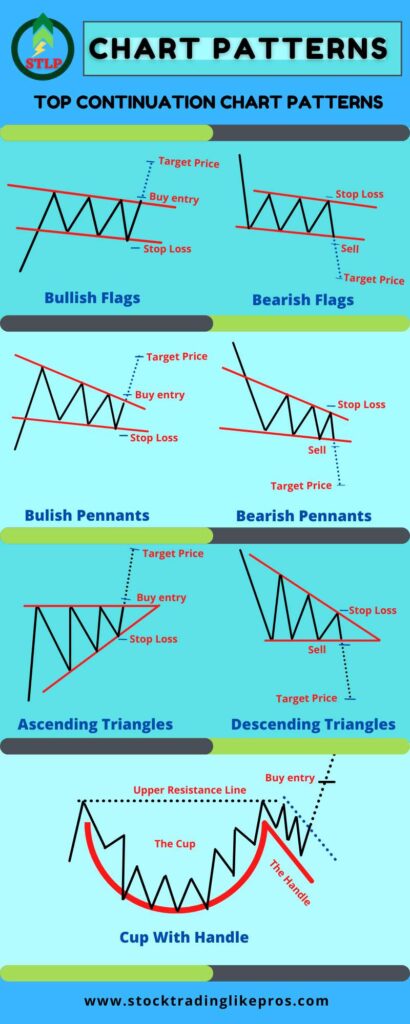
Flags are popular patterns found in stocks in strong uptrend or downtrend.
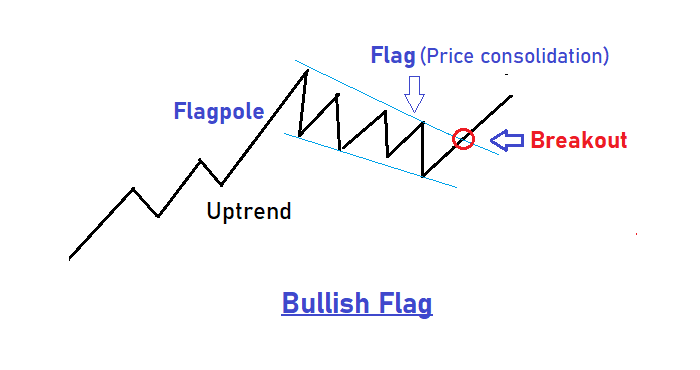
The pattern get its name from rectangular Flag like formation with a flagpole.
The flagpole gets formed due to a sharp vertical rise in a stock’s price and the flag results from price consolidation.
It is a very reliable continuation pattern to be traded in the direction of the existing trend.
There are two type of Flags Pattern – Bullish Flag in an Uptrend and Bearish Flag in a downtrend.
Bullish Flag
The bull flag pattern is a formation seen in stocks with strong uptrend. The formation will signal continuation of an existing bullish trend.
Volume usually increases in the pole and then decreases within the flag consolidation.
The resumption of the existing trend from the completion of flag happens through breakout to the upside. This breakout will often push the price higher with good volume on the breakout point or candle.
Bearish Flag
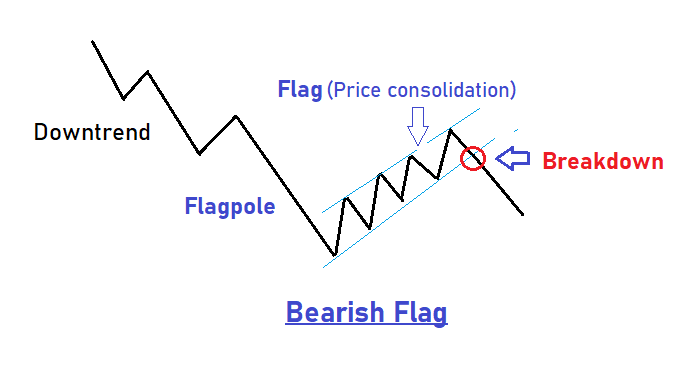
Bearish Flag is the bearish counterpart for Bullish Flag and is seen in stocks in strong downtrend.
Here again, the formation will signal continuation of an existing bearish trend. Volume usually increases in the pole and then decreases within the flag consolidation.
Price breaks out of this flag with heavy volumes to the downside, dragging the stock’s price to lower levels.
Bullish & Bearish flags are among the most reliable chart pattern for trading and one of the top trading strategies for Pro Traders.
Pennants
Pennants are another top continuation pattern to be traded in the direction of the existing trend.
They look very similar to flags formation and also behave same like a flag with a Flagpole, Price consolidation & breakouts.
The difference here is the structure of the consolidation period which looks like triangle in Pennants, as oppose to rectangle shape in flags.
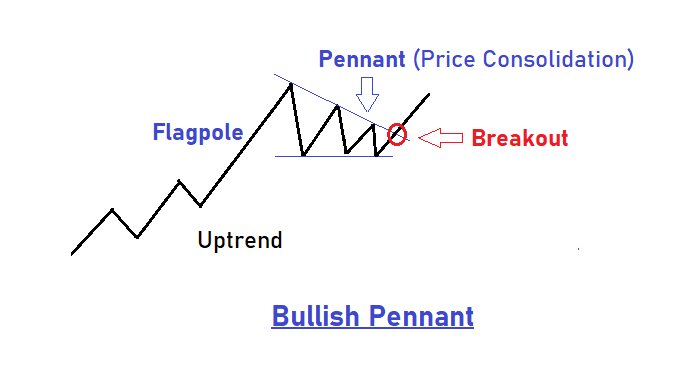
The triangle formation results from converging trend lines during the consolidation period.
Like Flags, it will have a flagpole with good volume with decreasing volume during the consolidation period.
Breakouts from this pattern happen with good volume.
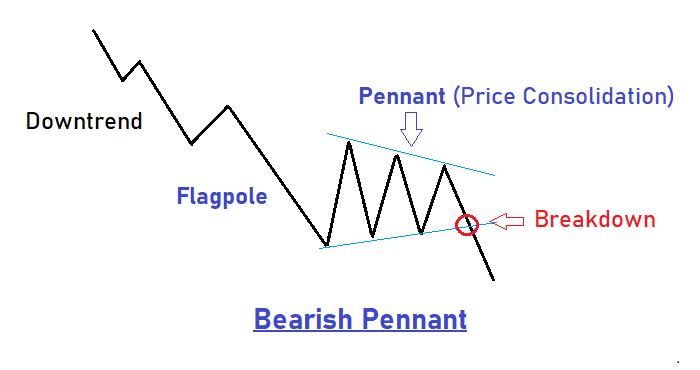
There are two type of Pennants Pattern – Bullish Pennant in an Uptrend and Bearish Pennant in a downtrend.
Volume, Price consolidation and trading breakouts of these pennants are similar to what we have seen for flags.
Triangle
The triangle pattern is a continuation chart pattern. It signifies the continuation of an uptrend after the formation of this pattern.
In this pattern, prices move in tight range in a triangle pattern indicating a tug of war between the bulls and bears.
The triangle pattern is mainly of three types- symmetrical pattern, ascending triangle, and descending triangles.
Ascending Triangle
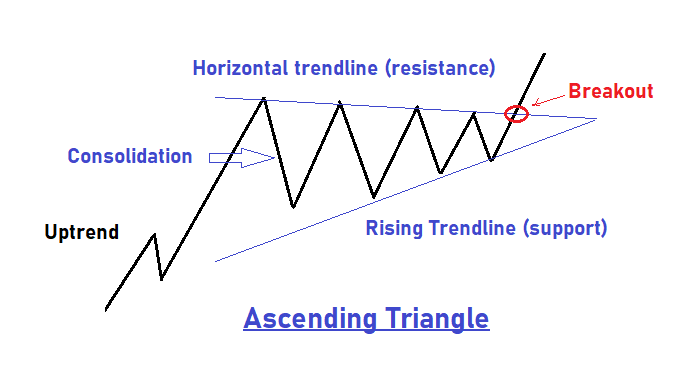
The ascending triangle is a bullish continuation chart pattern for trading any securities.
There are two converging trendlines in Ascending Triangle pattern – the lower trendline acting as demand line and horizontal trendline, acting as resistance.
The triangle area is the price consolidation which indicates bulls and bears in a battle and resulting in a trading range.
But the rising lower trend line gives a clear indication that bulls are getting stronger and stronger.
At one point of this triangle called Breakout point, bulls outpace the bears and stock begins to rise up in good volume.
Traders typically buy at this point to make quick profits from this sudden spurt of price and volume upwards.
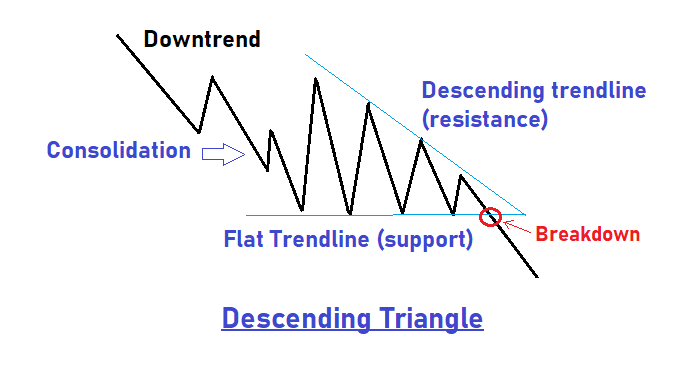
Descending Triangle
As opposite to Ascending Triangle, a descending triangle indicates bearish continuation of a downtrend.
Here again, there are two converging trendlines in Descending Triangle pattern – the upper descending trendline acting as resistance line and horizontal trendline acting as support.
The price consolidation in the triangle area signifies bulls and bears in a battle with no clear winner.
But the descending upper trend line gives a clear indication that bears are getting stronger and stronger.
At one point called Breakdown point, the Bears outpace the bulls and market goes almost in a freefall.
Here, a trader will enter a short position with a motive to profit from this falling price.
Cup and Handle Pattern

The cup and handle pattern is considered a very reliable bullish continuation pattern.
William O Neil introduced this powerful pattern and was first discussed in his book “How to make money in stocks”.
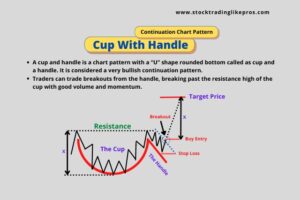
A cup and handle is a chart pattern with a “U” shape rounded bottom called as cup and a handle.
The pattern formation period could take somewhere between 1 month to year.
The cup has almost equal highs on both sides. A pullback from the right high of the cup forms the handle. The retracement is around 1/3 rd from the high of the cup.
We could also see a V shaped pattern but this should generally be avoided. Overly deep cup should also be avoided.
Volume normally decreases as prices decline till the base of the cup where it remains with low volume for some time.
Then, Volume increases when the price begins to move higher and test the previous high.
A successful Cup and Handle pattern will see breakout from the handle, breaking past the resistance high of the cup with good volume and momentum.
This presents a very good opportunity for Buyers to make quick profits from the price & volume momentum in just few days.
