Do you know why Pro traders love to trade flag pattern?
Traders love to trade flag patterns as it is a very reliable pattern to trade. The efficacy or the high win percentage of this pattern makes it a very good pattern to trade in the direction of the trend.
Famous Multi Millionaire Stock Trader Kristjan Qullamaggie is one such big gun trader who uses Flag pattern to make consistent & sizeable money from Stock Market.
Being a continuation pattern, it requires you to trade with the trend and not against the trend. Hence, the winning percentage is quite high usually with flag patterns.
Momentum traders love it because price gains very good momentum in quick time after successful entries and again, it gives a good opportunity to exit quickly with good profit.
Another reason to love trade flag pattern
A very good reason amongst all Pro traders to trade this pattern is that the pattern gives you wonderful opportunity for minimal risk entry with fabulous reward in just few days.
By taking minimal risk, the pattern can give you substantial move in the direction you expected. This substantial move is achieved through fast moving price breakouts from the flag pattern formation.
Before digging into how Professional traders use this in their trading strategy, let’s understand few basics on Flag pattern.
What are Flag Patterns?
Flag Patterns are a very popular continuation pattern commonly seen in a strong uptrend or a downtrend. The presence of the pattern in a stock’s chart denotes continuity of the existing trend for the stock after a short consolidation.
Why it is called Flag Pattern?
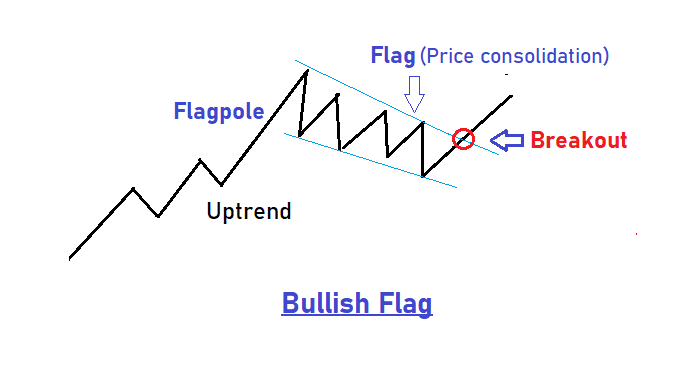
A flag chart pattern is formed when price consolidates within a narrow range after a sharp vertical move up or down.
This narrow range consolidation is what makes the flag. And the sharp rise or fall in price before the consolidation is what makes the flagpole.
Basically, two types of Flags can be seen in any chart.
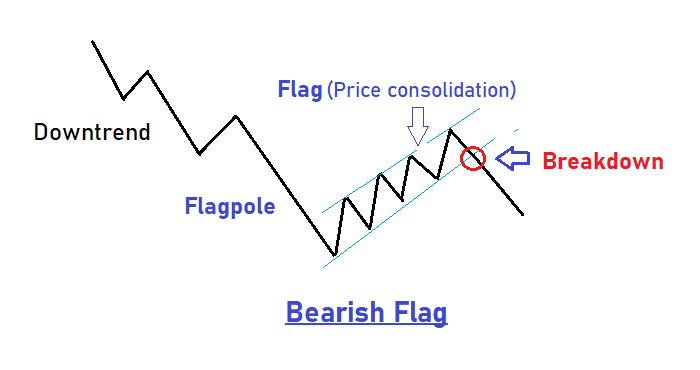
Flag Pattern found in an up trending stock is commonly known as Bullish Flag. Whereas, Flag pattern in a downtrend is called Bearish Flag.
Which Stock Trading Style uses this pattern?
Flag pattern trading is literally used by all kinds of traders – Be it scalper, intraday traders, Swing Traders or Positional Traders.
The pattern can be traded on all timeframes – 1 min, 5 min, 15-min, hour, day, week, months etc…and hence is a very reliable pattern for all types of traders.
How to trade Bullish Flag pattern?
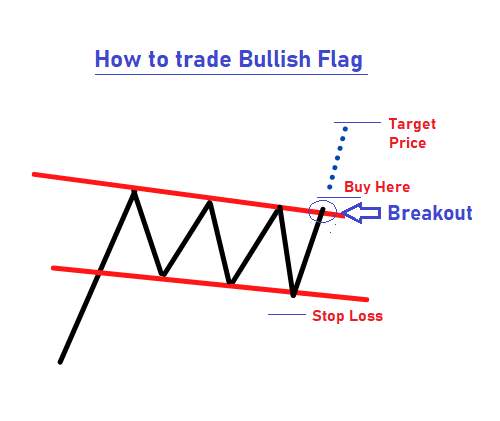
Bullish Flag Pattern is to be traded in the direction of an existing uptrend.
- Make the Buy entry when price breaks above the upper trendline connecting the upper highs of the flag pattern
- Place your stop loss below the lower trendline of the flag formation
- Target price could be taken as the distance of the upper and lower trendline parallel lines above the breakout price level.
For e.g if distance between the trendlines is 30, the target price would be taken as 30 points above the breakout price.
How to trade Bearish Flag pattern?
Bullish Flag Pattern is to be traded in the direction of an existing downtrend.
- Make the Short Sell entry when price breaks below the lower trendline of the flag pattern
- Place your stop loss above the upper trendline of the flag formation
- Target price could be taken as the distance of the upper and lower trendline parallel lines below the breakdown price level.
For e.g if distance between the trendlines is 30, the target price would be taken as 30 points below the breakdown price.
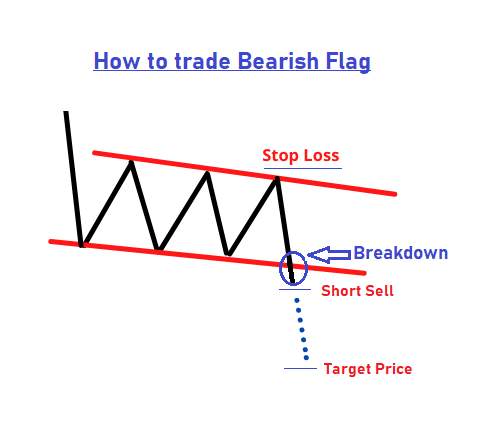
Let’s understand this in detail through the below chart for Centrum Capital.
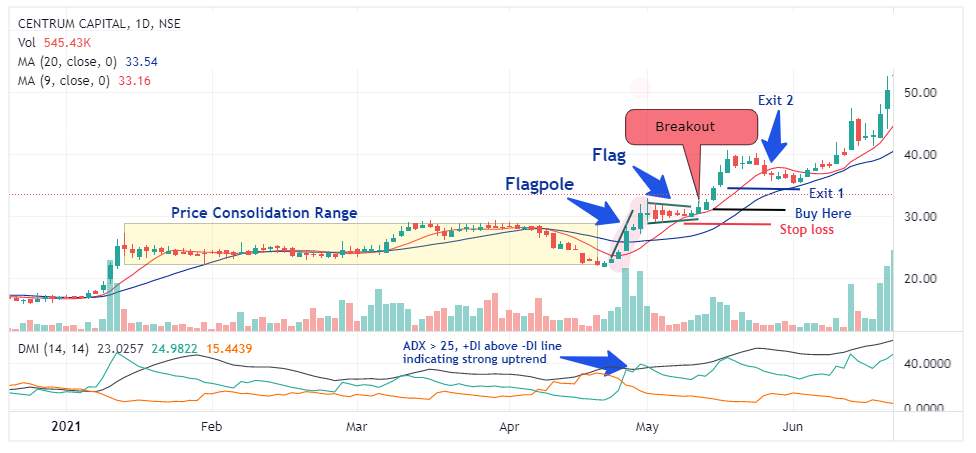
The Stock’s price has been on consolidation for almost 3.5 months, before it makes a sharp up move by last week of April’21 to start a strong uptrend.
The sharp rise in the price with good volumes to start the sudden uptrend move makes a Flagpole like formation.
The strong uptrend is evident as ADX stays well above 25 and positive directional indicator (+DI) is above the negative directional indicator (-DI) during this period.
By 1st week of May’21, the price then consolidates again into a rectangular / triangle flag like formation. This completes the Flag Pattern along with the preceding flagpole formation.
The formation should be confirmed through volume.
During the Flagpole formation, volume should spurt up in quick time (usually 3-4 days). And for flag formation, volume should taper off in the next 4-5 days.
The flag pattern consolidation broke out through a Breakout in the middle of May’21 with heavy volume. This lifts the price higher to resume the uptrend which stalled for a while.
Traders can look to trade the bullish flag pattern by making an entry during this breakout at around 31-32 price level.
Stop loss could be placed around 28-29 price level and profits can be booked or completely exit at around 34-35 price level.
Traders can also look to exit at little higher level of 38-39 level where price cross down 9 EMA.
The risk reward here you can get from this trade is very good, roughly around 1:4.
Now, let’s look at an example of a Bearish Flag Pattern in a downtrend.
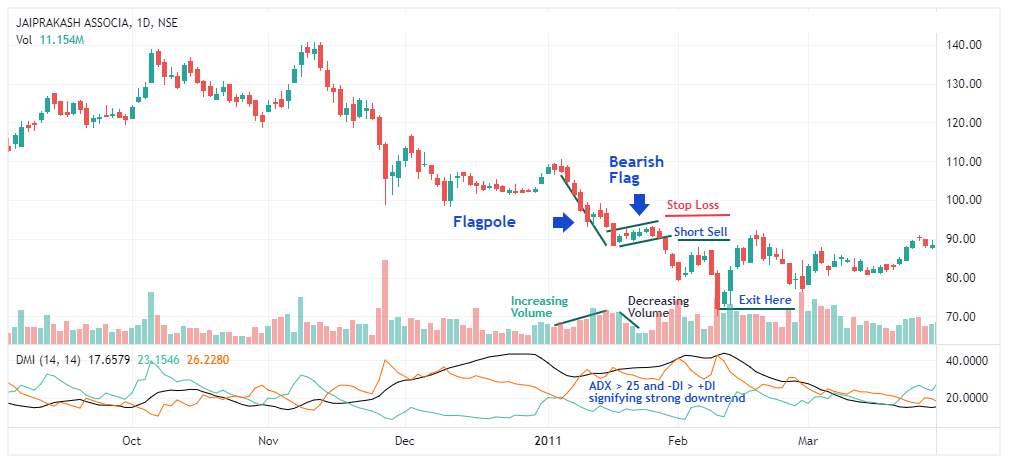
Price for JP Associates has been on a descent after mid of Nov’10 as it cannot break the previous high of Oct’10.
We can see a double top formation during this Oct-Nov’10 period or can consider a triple top formation if we take little lower peak of around 2 week of Oct’10.
The market consolidated for a while in Dec’10 before it resumes the downfall next month in Jan’11.
This continuation of the fall in price gets more significant after a Bearish flag formation within this month.
As you can remember, the key condition for a Bearish flag pattern formation is to have a strong downtrend.
This strong strength of the downtrend during the flag formation is evident as ADX > 25 and –DI is above +DI during this period.
This confirms our first condition for a strong downtrend.
Now, let’s understand the flag pattern formation.
The flagpole formation started by early Jan’11 and then continued till middle of Jan’11 where prices started consolidation again. The consolidation of the price forms a bearish flag.
Pay special attention to the volume during this pattern formation. The volume increases when the flagpole gets formed and then decreases during the flag formation.
Traders can look to short sell the bearish flag pattern after the breakdown at around 90-91 price level. Stop loss can be placed around 95-96 and can look to exit the trade successfully at around 80-81 price level.
This makes a good risk reward ratio of minimum 1:2.
Does it not make sense to use this flag pattern as a part of your trading strategy?
Hope you all do and make good money trading with flag patterns.
Happy trading.


