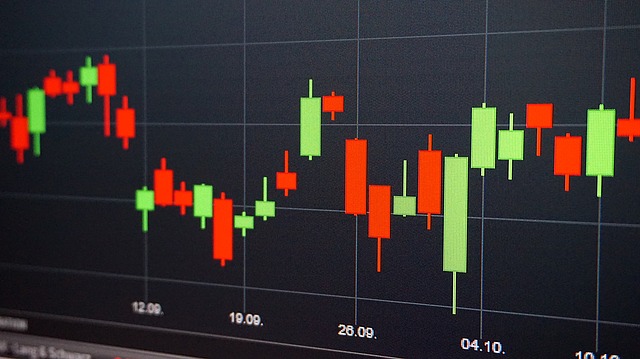
In the 17th century, Japanese traders use candlestick charts methodology to trade rice markets.
Much of the credit for candlestick development and charting goes to a legendary rice trader named Homma from the town of Sakata.
Later on, Candlestick was introduced into modern technical analysis by Steve Nison in his book Japanese Candlestick Charting Techniques.
Compared to bar charts, candlesticks are visually more appealing and easier to interpret price action.
A candlestick’s open and close as well as high and low tells a trader lot about the price action.
The relationship between its open and close of candlestick is what forms the essence of candlesticks.
Now, some basics on Candlestick charts
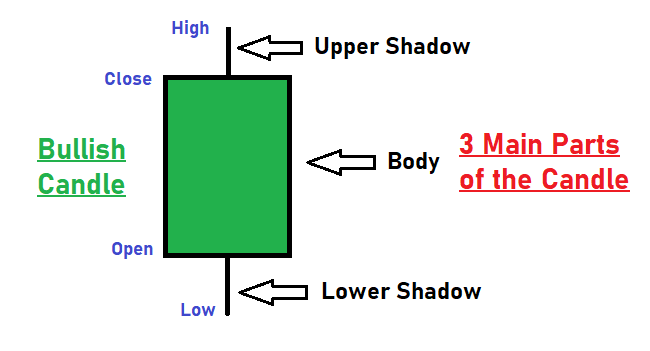
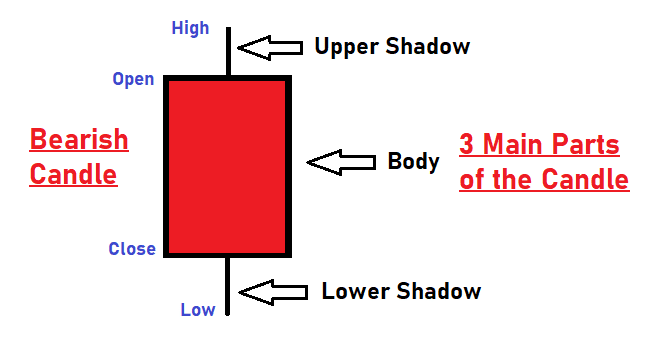
There are three main parts of a candlestick:
- Upper Shadow: The line between the high of the day and the close (bullish candle) or open (bearish candle)
- Real Body: The difference between the open and close; the meat portion of the candlestick.
- Lower Shadow: The line between the low of the day and the open (bullish candle) or close (bearish candle)
There are two basic candlesticks: Bullish and Bearish Candle
Bullish Candle:
Hollow candlesticks or usually shown as green filled.
This happens when the close is higher than the open indicating buying pressure.
Bearish Candle:
This is a filled/black Candlesticks or usually shown in red.
This happens when the close is lower than the open indicating selling pressure.
The longer the body of a candlestick, the more intense is the buying or selling pressure.
Conversely, short candlesticks indicate little price movement and represent consolidation.
In Candlestick charts, the upper and lower shadows on candlesticks can provide valuable information about the trading session.
Upper shadows represent the session high and lower shadows the session low.
Candlesticks with short shadows indicate that most of the trading action was confined near the open and close.
Candlesticks with long shadows show that prices extended well past the open and close.
Some Important Candlestick Chart lines
Doji Candlestick
A doji candlestick is a very popular & important candlestick for a trader.
It looks like a cross, inverted cross or plus sign .
The doji represents indecisiveness of buyers and sellers in the market. It is a key trend reversal indicator.
If the doji candlestick forms in an uptrend, it normally indicates uptrend is losing steam. The buying sentiment in the market has started losing momentum and could see reversal of the trend.
If doji is formed in a downtrend, it normally indicates downtrend is losing steam. The selling sentiment in the market has started losing momentum and and could see reversal of the trend.
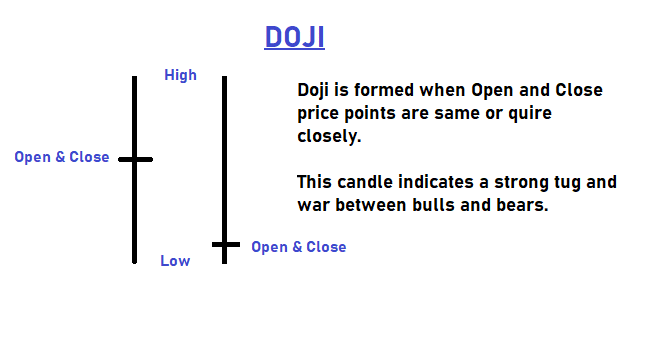
Different Forms of Doji Candlestick
There could be many forms of Doji Candlestick.
These Doji types represents the tug & war between bulls and bears in the candle’s price range.

Spinning Top
Spinning top is a candlestick line with small real body body and two long shadows or wicks.
A spinning top again happens when there is an indecisiveness in the market between buyers and sellers.

If a spinning top is formed after a prolonged uptrend, it suggests that the bulls are getting weaker.
A reversal can happen anytime soon.
On the other hand, if this is formed in a downtrend, it suggests that the sellers are losing getting weaker.
And again, a reversal of the trend to uptrend is most likely.
Now that you are through with the basics, it is very important to understand the true power of candlestick trading through candlestick chart patterns.


