Trading moving average strategy like a Pro trader is a very simple and powerful strategy.
Before we understand in detail how Pro traders use Moving Averages, let’s understand few basics.
What are Moving Averages?
Moving Average is a widely used indicator in Technical Analysis that smooths out price data to show underlying price trend direction. It helps traders to filter out noise from spiked charts of prices.
In fact, it is one of the most commonly used indicator by traders. Novice traders prefer to start trading with Moving Averages because of its simplicity.
The main attraction of Moving Average Indicator for traders is that it can be used in any time frame and by using any trading styles – Scalping, Intraday, Swing Trading, Positional trading or Long term trading.
Hence Moving Average is a very useful tool for both short term traders or long term investors.
The indicator is a trend following Indicator and hence would work only in an uptrend or a downtrend.
Remember, Moving Average should never be used in a range bound market.
How is Moving Average calculated?
Moving Average is plotted as a line of averages of past prices.
For example, a 9 day moving average of a stock on a particular day would be the average of its price over the last 9 days. Each average is then connected to form the Moving Average line.
Types of Moving Average
The two basic and commonly used MAs are the Simple Moving Average (SMA) and Exponential Moving Average (EMA)
SMA is the simple average of stock price over a defined number of periods while EMA gives more weight to recent prices.
For example, If you have a 20-day SMA and a 20-day EMA on the same chart, 20 day EMA would react more quickly to changes in price than the 20 day SMA.
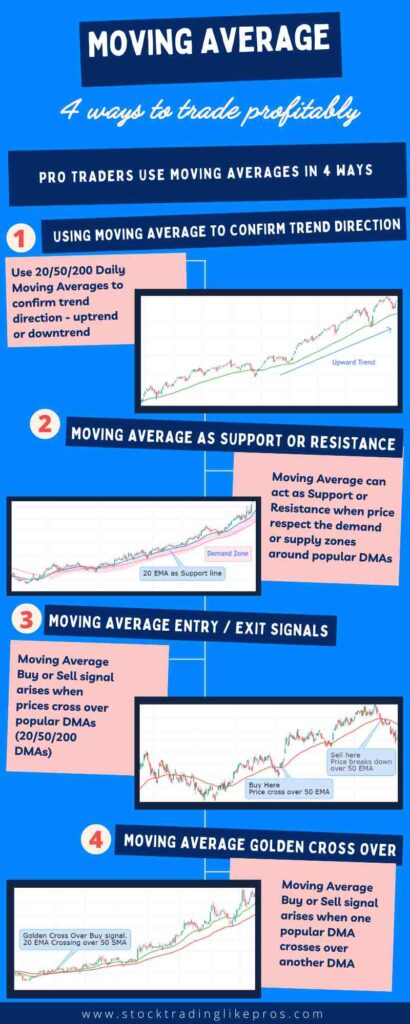
Now that you know the basics, let’s jump quickly to understand how a Pro Trader could use the below 4 different ways to trade using Moving Average.
- Use Moving Average to confirm trend direction.
- As Support and Resistance.
- Moving Average as Entry / Exit Signals: On crossover of price / moving average cross-over or pullback to moving average.
- Trading Golden Crossover of Moving Averages.
1. Moving Average to confirm trend direction
Moving Average cannot predict trend. It can only confirm a trend direction.
The most commonly used Moving Averages are 20 DMA, 50 DMA and 200 DMA. (DMA: Day Moving average – Simple or Exponential).
This could differ from trader to trader based on their trading style and their timeframes used for trading.
Personally, I prefer to use 10 EMA, 20 EMA and 50 EMA being a short term trader.
So, how does Moving Average confirm trend direction?
In a trending market, the trend is considered to be up if the shorter moving average is above the longer term moving average.
And if the shorter moving average is below the longer moving average, the trend is considered to be down.
Let’ understand this better from the below chart for Axis Bank where we have plotted 20 and 50 day EMA on the same chart.
Axis Bank is a very strong trend from early week of Oct’20 as the shorter term 20 EMA starts going above the longer term 50 EMA.
The trend remains quite strong till last week of Mar’21 where both the moving averages start converging. And in 1st week of April’21, the short term 20 EMA starts going down below 50 EMA to break the uptrend & starts a steep downtrend.

2. Moving average as Support or Resistance
Another common use of Moving Average for is as Support or Resistance.
In the below example for Apollo tyres, there is an uptrend with close support at 10 EMA.
Traders can ride on this trend using the moving average as 10 EMA acts as a strong support. We can use trailing Stop losses below 10 EMA.

3. Moving Average for Entry / Exit Signals
When a Stock’s price crosses over a moving average from below in an uptrend, it indicates that the stock is in a bullish state. And this cross over point is a wonderful opportunity to buy the stock.
For example, when price crosses over the 20 DMA in an uptrend, traders know that bulls have started getting stronger. Hence, they can plan to buy at the crossover point.
Similarly, traders can short sell when the price crosses down 20 DMA when bears start getting more stronger.
Another variation for trading moving average strategy is to look for pullback to moving averages. Traders popularly love pullbacks trading to 20 or 50 DMA.
The buy trade entry can be made on the green pullback candle to enter an uptrend. And for short entry through pullback during a downtrend, it can be done on the red pullback candle.
4. Trading Golden Cross
Moving Averages Crossover is one of the most basic trading strategies of Stock Pro traders.
Golden cross is a trading moving average strategy where a short term moving average cross over a long term moving average line from below.
This is popularly used by Pro Traders in the 20/50 Trading set up.
When the 20 SMA crosses over the 50 SMA from below in an uptrend, the cross over of the 2 moving averages is a Golden Cross.
This Moving Average cross over presents a good signal to buy the stock after the cross over point.
Similarly, when 20 SMA crosses down the 50 SMA from above in a downtrend, it is called a Death Cross.
Similar to Golden Cross, Death Cross gives a very good opportunity to trade but to short sell the stock in a downtrend.
Let’s understand this in detail with an example for Lupin, where all the above points are best explained from its chart.

Lupin is in uptrend and traders can enter the trade the Golden Cross when 20 SMA crosses over the 50 SMA in last week of June’14. Same opportunity could be seen again in early Feb’15.
Another good opportunity to buy Lupin Stock could be seen in Nov’15 when we see price pulls back to 20 MA and bounces off 50 SMA.
Limitations of Moving Averages
Being a price lagging indicator, one of the most common problem with moving average is that it lags the price. Therefore, it gets you in the trend rather late.
Moreover, it gives whipsaws in sideways market. Hence, Moving averages should be avoided in range bound market and be used only in trending market.
Pro Traders excel in trading moving average strategy by doing one key thing –
They use Moving Average in conjunction or in confluence with other entry signals through other Indicators, Chart patterns…


